Okay so this morning I spilled coffee all over my flood zone map and got me wondering – how the heck do people even figure out that “100-year flood” thing? Sounds super complicated, but there’s gotta be a way without being a scientist, right? Grabbed my laptop feeling kinda stubborn.
Figuring Out What We Need
First thing, needed some real numbers. Went digging online, typing stuff like “river X flood data” (since I live near the Muddy River, sorry, gotta keep it vague!). Found this official-looking report finally. Buried deep inside was a tiny table showing the big floods they measured over, like, 70 years. Sweet. Copied just two things down in my notebook:
- The highest flood level measured that whole time
- How many years total they were looking at
For my pretend river, say the biggest flood was 15 feet, and they watched it for 70 years. That’s all I started with.
The “Hmm, That Seems Too Simple” Idea
Started poking around more. Stumbled on this basic idea: if you know the biggest flood in a time period, you can kinda make a guess about how likely a bigger one is. Found a formula that made my eyes glaze over at first: (Years of Record) / (Years of Record + 1). What does that even mean?
Took the numbers I had. 70 years of watching, biggest flood 15 feet. Plugged them in: 70 divided by (70 plus 1)? So that’s 70 / 71. Grabbed the calculator app. 70 ÷ 71 equals… roughly 0.9859. Okay, decimal. What does that tell me?
The Lightbulb Moment (Mostly)
Read that this decimal tells me the chance the river won’t flood higher than 15 feet in any single year. So 0.9859 means about a 98.59% chance each year the water stays below 15 feet. Kinda makes sense.
But I wanted the opposite – the nasty surprise flood chance! Flip it: 1 minus that decimal. So 1 – 0.9859 = 0.0141. Means every year, there’s roughly a 1.4% chance of a flood bigger than that recorded monster 15-footer. Felt like I was getting somewhere!
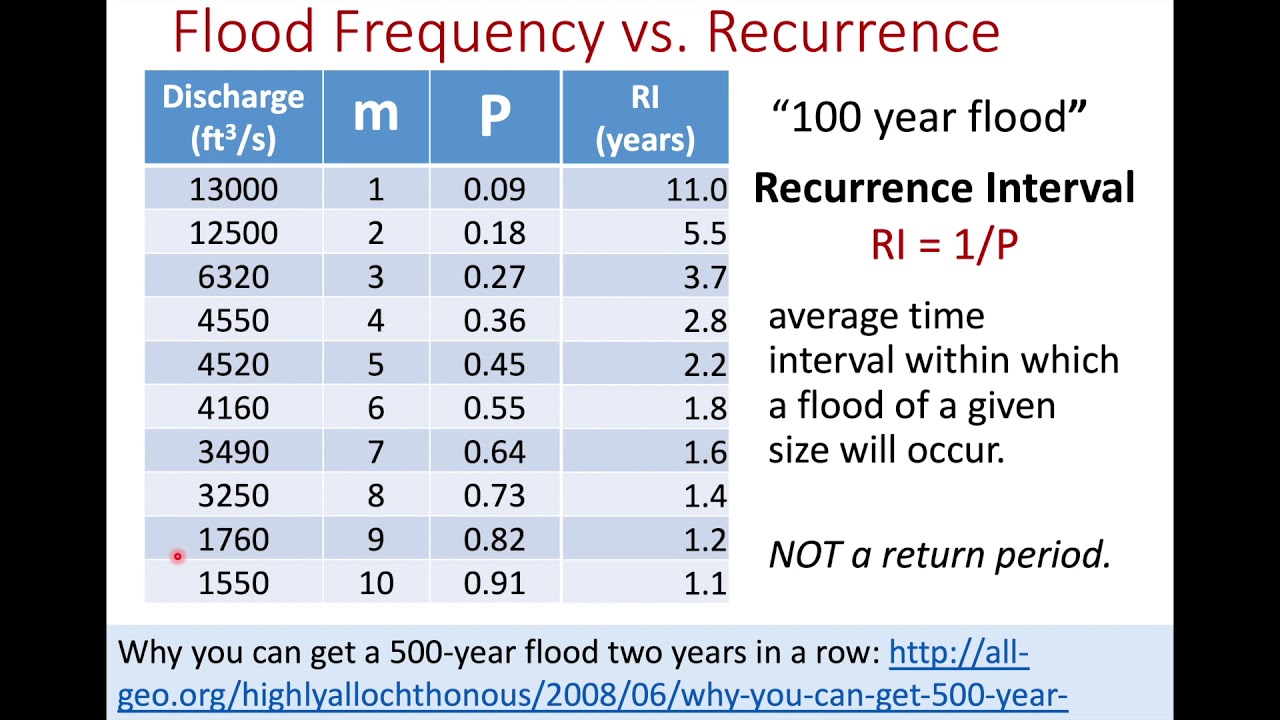
Connecting to the “100-Year” Thing
Here’s the kicker everyone talks about: The “100-year flood” probability means the chance it happens in any single year is 1%. Like rolling a specific number on a 100-sided die each year. My calculation gave me 1.4%. That was higher than 1%. Made me go hmm.
- My estimate says: Big flood bigger than the 70-year record? ~1.4% chance per year.
- 100-year flood definition: ~1% chance per year.
My calculation showed the recorded flood (15 ft) was actually a bit more common than a true 100-year event. The actual 100-year level for my river might be a few inches higher than 15 feet! Suddenly that map not being 100% solid made sense.
What Did My Kitchen Table Math Tell Me?
It ain’t perfect. Using just the one highest flood level from a limited time is kinda crude – like looking at only the top score in a dice game and guessing the die’s sides. Real scientists use all the floods every year to get much finer numbers.
But honestly? This simple trick using just two numbers – total years watched, and highest flood level seen – gave me a real gut feeling for the odds. That little 1.4% chance per year? It adds up scarily fast. That’s a better than 1-in-6 chance in 100 years! Never trusting that “100-year” label quite the same way again. Might build that ark sooner. Seriously, just grab the biggest flood height and how long folks watched, do the division, flip the decimal, and boom – you see the annual risk yourself. Freaky how high even a tiny percent feels.