
Okay, let me tell you how I finally got my head around this DuPont thing. For ages, I’d look at a company’s ROE, you know, Return on Equity, and think, “Alright, that number looks good,” or “Hmm, that’s a bit low.” But I never really got what was driving it. It felt like looking at the final score of a game without knowing how anyone played.

Then I stumbled across this DuPont analysis idea. Sounded fancy, but the core idea seemed to be about breaking that ROE number down. So, I decided to give it a shot with a company I was following.
Figuring Out Part One: How Much Profit on Sales?
First, I tackled the easiest bit: profit margin. Basically, how much actual profit does the company squeeze out of every dollar of sales? I grabbed their income statement, found the net income, found the total sales, and did the division. Simple enough. Okay, so this company makes X cents for every dollar it sells. Got it. That tells me if they’re selling stuff at a good markup or if they’re cutting prices super low.
Part Two: Getting Goods Out the Door
Next up was asset turnover. This one took a bit more digging. It’s about how efficiently the company uses all its stuff – its factories, equipment, inventory – to actually generate sales. Are they getting a lot of bang for their buck from their assets, or do they have tons of money tied up in stuff that isn’t selling fast? I had to look at the sales number again and compare it to their total assets (usually averaged over the year). Calculating this showed me how quickly the company was moving its inventory or using its machinery. Some companies turn over assets like crazy, others are slower. It gave me a feel for their operational speed.
Part Three: The Debt Factor
The last piece was financial leverage. This sounded intimidating, but it boiled down to how much the company relies on borrowing money (debt) compared to the owners’ money (equity). More debt can boost the ROE if things go well, because you’re using other people’s money to make profits for the owners. But it also adds risk. If things go bad, that debt still needs paying. I looked at the balance sheet again, comparing assets to equity. This ratio told me how much the company was leaning on debt. A higher number meant more leverage, potentially higher returns, but definitely higher risk.
Putting It All Together
So, I had these three numbers:
- How profitable their sales were.
- How efficiently they used their assets.
- How much debt they were using.
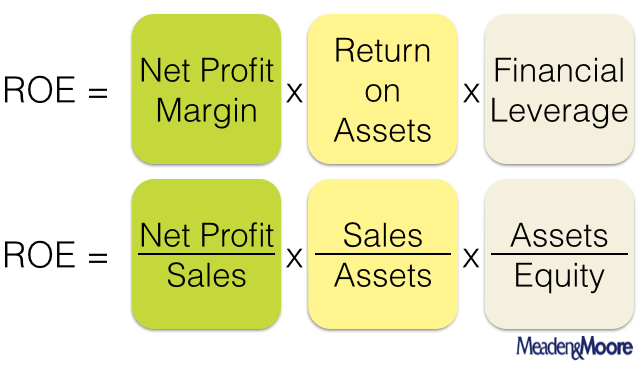
The cool part? When I multiplied these three numbers together – the profit margin times the asset turnover times the financial leverage – guess what? It equaled the ROE I started with! Suddenly, it wasn’t just a single number anymore. I could see why the ROE was what it was.
Was the company super profitable but slow with its assets? Or maybe not very profitable per sale, but they turned over assets really fast and used a lot of debt? This breakdown told the real story behind the final number. It stopped being just about the destination (ROE) and became about the journey – the strategy the company was actually using. Made a huge difference in how I looked at company performance after that.